What is GAP?
BACKGROUND (This information is also available on www.gap.csir.co.za)
The South African policy and planning environment has, in recent years, been characterized by a renewed focus on the need for aligned, collaborative, as well as spatially coordinated and targeted investment. A clearly articulated set of spatial priorities and criteria is one of the mechanisms through which government provides a strategic basis for focusing government action, weighing up trade-offs and linking strategies and plans of the three spheres and agencies of government. In order to enhance planning frameworks and growth and development strategies at district, provincial and national spheres, as well as to established a shared platform for analysis to inform co-ordinated planning and investment by the three spheres of government, a critical need has been identified for more robust, as well as comparative spatial analysis of a variety of functional and administrative areas/boundaries.
THE RESEARCH
In response to these challenges the CSIR produced the Geospatial Analysis Platform (GAP). The SA Geospatial Analysis Platform (GAP) can be described as a common, mesoscale geo-spatial platform for the assembly, analysis and sharing of economic, development and demand information. Considerable research was undertaken as part of a related CSIR project to demarcate, link and derive inter-operable datasets for these zones. This involved the development of techniques to:
- Demarcate zones so that their edges coincide with important administrative and physiographic boundaries
- To address the so-called ‘Gordonia problem which refers to arbitrary zone-size distortions of quantity maps
- Overcome the so called “island approach” where the analysis and planning of local economies and administrative areas occur as if there are islands with no linkages to the surrounding region.
The core component of GAP is the meso-scale geoframe for South Africa, a demarcation of South Africa into a grid of more than 25000 mesozones, each approximately 50km2 in size (See figure 1)
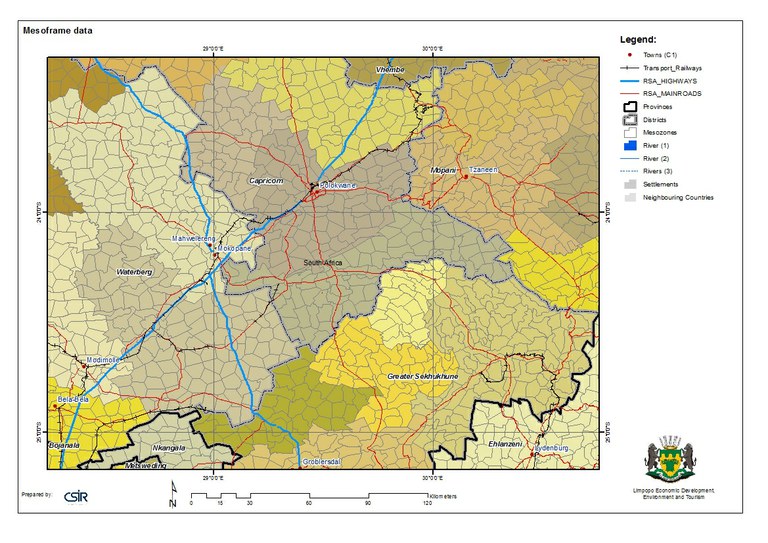
Figure 1: Illustration of mesozones.
These mesozones were created in such a way that they are nested within the municipalities and other significant geo-economic and historic area demarcations. The zone boundaries correspond with major travel barriers (such as rivers) as well as “break lines” between sparsely populated areas (such as mountains) and areas with medium to high levels of human activity (such as fertile valleys of built up areas). The mesozones are also linked to a strategic national road network. Spatial interaction modelling was used to derive inter-zonal distance and travel time tables and these in turn can be used to calculate a range of accessibility and proximity measures.
INTENDED USE OF GAP
The intended general uses of GAP2 can be summarized as follows.
- Developing an enhanced understanding of South Africa’s human/economic geography and the associated interactions with the built and natural environment.
- Profiling and comparing local development magnitudes (needs, potentials, service and economic accessibility levels) from a strategic, district / regional perspective.
- Providing a basis for addressing key development planning questions.
METHODOLOGICAL FOUNDATIONS
GAP is strongly based on the CSIR’s mesoframe methodology, which takes its name from the irregular, meso-scale geoframe that was developed as the primary component of what has become the Geospatial Analysis Platform (GAP). The other two components include a) a workbench for multi-scale spatial data mining, and b) network datasets and analysis tools - used to link local areas in terms of larger regions, and calculate a variety of accessibility and regional concentration indicators.
Figure 2: Main components of the GAP platform
GENERAL FUNCTIONAL SPECIFICATION
Seen from a functional perspective, GAP can be described as a common, meso-scale geospatial platform for the assembly, analysis and sharing of strategic geospatial information. Stated in more detail, GAP can be used for:
- Assembling, aggregating and exchanging mesoscale information on key human need, demand, potential, economic accessibility and sustainability variables.
- Profiling and comparing local development magnitudes (indicating “how much is where”) from a strategic, district / regional perspective.
- Undertaking strategic pattern analysis and hot-spotting.
- Identifying adjoining zones and/or wider functional regions, and developing a range of accessibility and reach indicators (i.e. indicating “how much can be reached from where”).
- Constructing a range of composite territorial indicators (e.g. composite indicators of service delivery need or economic potential) from a combination of: a) local area or intra-locational variables; b) surrounding area, proximity, accessibility, and other inter-locational variables; and c) regional variables.
- Developing an enhanced understanding of South Africa’s human/economic geography and how economic activity interacts with the built and natural environment.
- Providing a basis for contextualisation and customisation of government policies and general service delivery strategies in accordance with “structurally different” types of contexts and/or relevant territorial indicators.
MESO-SCALE DEFINITION AND RELEVANCE
The term meso-scale should be seen to refer both to a specific proposed convention (for a specific commonly used reference scale) and to a possible extended range of “meso-scales” (which could be more or less than the agreed convention for a commonly used scale, and vary according to the specific purpose or geographic extent of the relevant study area). The proposed convention for a commonly used meso-scale reference – in the South African context at least – is an intermediate, 5-10 km scale of spatial resolution and associated data accuracy. This is deemed to be a relevant as well as computationally feasible scale for undertaking: a) the assembly and rescaling of a variety of macroscopic and microscopic data layers; b) the construction of computationally manageable inter-zonal distance or interaction matrices; c) regional analysis and planning; d) robust, strategic-level comparisons of local development and related magnitudes; and e) bandwidth-efficient electronic transmission and sharing of strategic geospatial information.
Figure 3: Focus for GAP platform.
KEY FOCUS
The key focus of GAP is referring particularly to the “how much is where?” type of question – is mainly on human/ economic activity and population variables (such as volumes of economic activity or persons below the minimum living level) and derived indicators such as demands on infrastructure and ecosystem services. In order to also address relevant explanatory questions (e.g. why does this area seem to have the highest concentration of employment opportunities?) or derived demand questions (e.g. what are the cumulative human activity related demands for infrastructure and ecosystem services in this region?), the range of estimated mesozone indicators is extended via linkages with other domain-specific information systems (such as AGIS – the SA Agricultural Geo-referenced Information System), models and/or web-linked analysis services (planned to be a key feature of future GAP deployments).
For more technical descriptions and documentation on the platform and it’s development go to the www.gap.csir.co.za site.
